Building a Shopify Orders Analytics Dashboard Using Webhook Data
An analytics dashboard is only as useful as the data behind it.
For Shopify apps, one architectural decision is whether to fetch order data from Shopify every time a merchant opens a report or maintain application-specific analytics records from webhooks.
For dashboards that track a specific category of purchases, storing relevant events can simplify reporting and reduce the need for repeated live queries.
Separate event collection from reporting
A webhook-driven analytics system has two main responsibilities.
The first is collecting and processing order events. The second is transforming stored records into useful metrics.
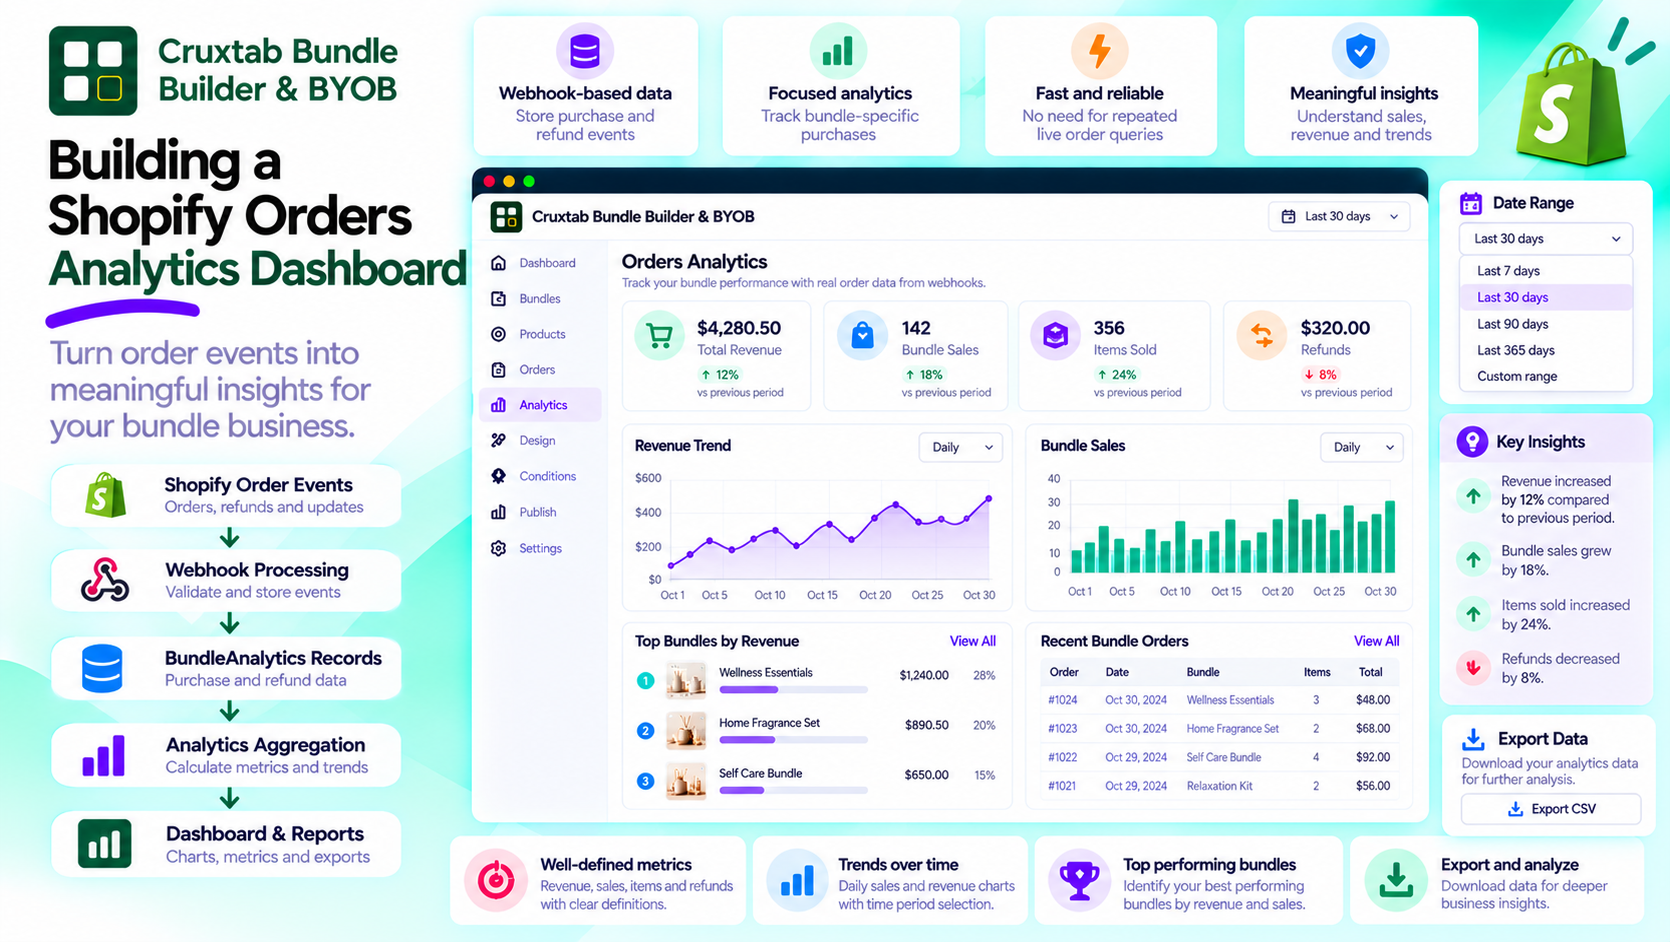
A simplified architecture looks like this:
Shopify Order Events
        |
        v
  Webhook Processing
        |
        v
 Purchase and Refund Records
        |
        v
 Analytics Aggregation
        |
        v
 Dashboard, Charts and Exports
This separation allows the reporting interface to focus on displaying information rather than fetching and processing every order during each page load.
Define metrics before building charts
Before implementing a dashboard, decide what each metric means.
For example:
- Revenue: gross purchase value or revenue after refunds?
- Sales: number of bundle purchases or number of Shopify orders?
- Items: number of bundle units or total individual products?
- Refunds: refunds recorded against purchases or refunds issued during the selected period?
These definitions matter because two dashboards can display different numbers while using the same underlying order data.
Aggregate stored records
A simplified revenue calculation might look like this:
function calculateNetRevenue(purchases, refunds) {
  const purchaseTotal = purchases.reduce(
    (sum, row) => sum + row.amount,
    0
  );

  const refundTotal = refunds.reduce(
    (sum, row) => sum + row.amount,
    0
  );

  return purchaseTotal - refundTotal;
}
This example assumes amounts use a consistent currency and representation. A production implementation should handle multiple currencies, partial refunds, duplicate events, and precise monetary arithmetic.
Visualize trends over time
Daily sales data can help merchants identify changes in performance. A line chart can show daily revenue, while summary metrics provide a quick overview.
For accurate reporting, developers must account for date boundaries, time zones, and days without activity.
Conclusion
Webhook-based analytics can provide an effective foundation for Shopify reporting when the application needs a focused view of particular purchases.
The Orders feature in Cruxtab Bundle Builder & BYOB uses stored BundleAnalytics purchase and refund rows to power its dashboard rather than querying live Shopify order data.
Explore the app: https://apps.shopify.com/cruxtab-bundle-builder
The key lesson is to establish trustworthy data and well-defined metrics before investing in dashboard visuals.
Comments
Join the discussionNo comments yet. Be the first to comment.